Time-series visualization in python
Oct 29, 2020· ·
1 min read
·
1 min read
Dr. Georg Heiler
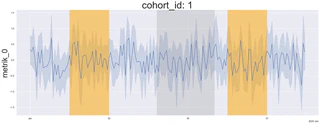 Time-series with annotated labels for certain intervals.
summary
I hope this is also useful for you when visualizing data in the context of time.

Authors
senior data expert
Georg is a Senior data expert at Magenta and a ML-ops engineer at ASCII.
He is solving challenges with data. His interests include geospatial graphs
and time series. Georg transitions the data platform of Magenta to the cloud
and is handling large scale multi-modal ML-ops challenges at ASCII.