Fully-fledged example with resources

Welcome 😄 to this blog series about the modern data stack ecosystem.
post series overview
Here in part 3, a more fully-fledged example is presented. The code here is based on the official https://docs.dagster.io/guides/dagster/example_project hacker news example. However, it was altered to make it easily usable without the various cloud services for direct local exploration without further dependencies needed.
After downloading assets from the HackerNews API using a python-based scraper, they are stored as assets in a database. Further transformations are computed using DBT. Instead of traditional very long hand hard to understand SQL statements it caters towards reusable and tested SQL snippets. Furthermore, the testability of complex data pipelines is shown by utilizing the concept of a resource.
The other posts in this series:
- overview about this whole series including code and dependency setup
- basic introduction (from hello-world to simple pipelines)
- assets: turning the data pipeline inside out using software-defined-assets to focus on the things we care about: the curated assets of data and not intermediate transformations
- a more fully-fledged example integrating multiple components including resources, an API as well as DBT
- integrating jupyter notebooks into the data pipeline using dagstermill
- working on scalable data pipelines with pyspark
- ingesting data from foreign sources using Airbyte connectors
- SFTP sensor reacting to new files
separation of business logic and IO/execution resources increases the testability
By separating the business logic from the resources needed for execution or IO of the data pipeline, the business logic becomes:
- faster to develop: A well-defined (small) test-data set allows to iterate faster as feedback is available to the developer immediately. Think about schema changes: In the current segregated data landscape, it is impossible to know if a schema change here will affect a data pipeline of another department. Nevertheless, with the E2E lineage modeled, experimentation becomes possible: Immediately, any changes give feedback about potential problems in downstream affected pipelines.
- new data developers are productive faster: they can get started with the E2E data pipeline on their machine
- the testability of the E2E pipeline is improved by a big factor. This increases the overall quality of the pipeline
The following code extract showcases how instead of a full-blown cloud-based distributed computation of spark in perhaps DataBricks - instead, a simple local spark context is instantiated:
with tempfile.TemporaryDirectory() as temp_dir:
        io_manager_test_ag = AssetGroup(
            assets=[pandas_df_asset, spark_input_asset],
            resource_defs={
                "pyspark": pyspark_resource,
                "io_manager": local_partitioned_parquet_io_manager.configured(
                    {"base_path": temp_dir}
                ),
            },
        )
        io_manager_test_job = io_manager_test_ag.build_job("io_manager_test_job")
The tests can be executed using standard python testing tools like, i.e. pytest:
cd hacker_news_assets
pytest hacker_news_assets_tests

=========== 7 failed, 7 passed, 117 warnings in 14.43s ===========
You should observe some passing and other failing tests with a clear indication of what causes the problem.
overall lineage
This repo contains three jobs:
hacker_news_api_download- This job downloads events from the Hacker News API splits them by type, and stores comments and stories into separate tables in our local DuckDB database.
story_recommender- This job reads from the tables that
hacker_news_api_downloadwrites to and uses this data to train a machine learning model to recommend stories to specific users based on their comment history.
- This job reads from the tables that
dbt_metrics- This job also uses the tables that the
hacker_news_api_downloadproduces, this time running a DBT project which consumes them and creates aggregated metric tables.
- This job also uses the tables that the
The hacker_news_api_download job runs on an hourly schedule, constantly updating the tables with new data.
The story_recommender job is triggered by a sensor, which detects when both of its input tables have been updated.
The dbt_metrics job is triggered by a different sensor, which will fire a run whenever hacker_news_api_download finishes.
Each job uses resources, which allows data to be read from and written to different locations based on the environment.
To allow the sensors and schedules to work, the dagster daemon needs to be enabled:
conda activate dagster-asset-demo
dagster-daemon run
Once it is enabled, you will observe a green stopwatch icon around any scheduled job with an active schedule. As

As we set the DefaultScheduleStatus to RUNNING using:
schedule_from_partitions(download_local_job, default_status=DefaultScheduleStatus.RUNNING)
No further manual action is necessary to enable the sensor after loading the job into dagit.
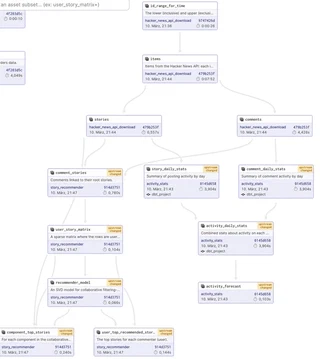
Furthermore, the overall asset graph can be viewed in unison: Even though the HN example use case is split into three jobs utilizing a variety of tools (DBT,DuckDB, python-based machine learning) it is still possible to view the overall data dependencies (lineage) on a single pane of glass:
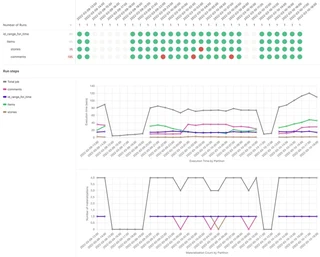
After executing the graph (by waiting for the sensor to trigger once per hour) or by executing a couple of backfills, various materialization statistics are collected and directly visualized in the dagit UI:
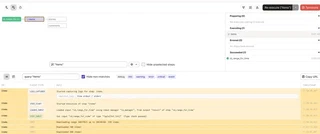
Furthermore: Once a running materialization is in-flight you can directly observe the structured logging capability of dagster:
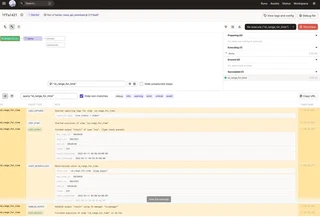
Logs for any specific step of the pipeline can be filtered interactively:
Furthermore note that DBT by itself can genrate documentation:
https://docs.getdbt.com/docs/building-a-dbt-project/documentation about the lineage of ots graph using: dbt docks generate and dbt docks serve.
Summary
Dagster improves the quality of data pipelines by catering towards the separation of business logic and IO. Therefore the various dependencies to external or perhaps costly systems can be removed and the testability of data pipelines increases dramatically. Furthermore, this allows the data developer - similar to a software developer to gain instant feedback on the changes of one component in the data pipeline - and the impact on other downstream components.
