Tame your notebooks
Welcome 😄 to this blog series about the modern data stack ecosystem.
post series overview
Data scientists love notebooks - but the persons involved in operationalizing their results frequently hate them. Inputs and outputs are not clearly defined. Sometimes, the order of execution between the cells is non-linear (jumping around back and forth).
Even unicorn startups like Netflix observe this problem. But they take action: Netflix created papermill. It allows to parametrize jupyter notebooks and execute them in a well-defined manner.
With Dagstermill dagster offers native integration into papermill. Thus scientific notebooks or explorative analytics can directly be chained into E2E data pipelines, which remain fully operable and non-chaotic! In fact, for exploratory or visual analyses, looking at the actual plots directly in notebooks can be beneficial.
The other posts in this series:
- overview about this whole series including code and dependency setup
- basic introduction (from hello-world to simple pipelines)
- assets: turning the data pipeline inside out using software-defined-assets to focus on the things we care about: the curated assets of data and not intermediate transformations
- a more fully-fledged example integrating multiple components including resources, an API as well as DBT
- integrating jupyter notebooks into the data pipeline using dagstermill
- working on scalable data pipelines with pyspark
- ingesting data from foreign sources using Airbyte connectors
- SFTP sensor reacting to new files
integrating a notebook into the graph
The code example here is based on the official dagstermill documentation and various example codes related to this topic in the examples folders.
Step 1: We need a dataset! Dagsters documentation is often referring to a cereal example dataset. Lets use this one for the example here as well.
It contains calories and further information about various flavors and types of cereals.
Initially, the dataset needs to be downloaded.
As the dataset (source/URL) and its output location might need to change in the future or a different environment - let`s feed them as a configuration parameter to the operation.
@op(config_schema={"url": Field(str, description='I am an URL.', default_value=CEREAL_DATASET_URL),
"target_path": Field(str, description='I am a temporary storage location.', default_value="warehouse_location/cereal")})
def download_file(context) -> str:

    url = context.solid_config["url"]
    target_path = context.solid_config["target_path"]

    with open(target_path, "w") as fd:
        fd.write(requests.get(url).text)

    get_dagster_logger().info(f"storage path: {target_path}")
    return target_path
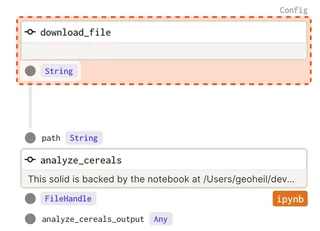
A notebook can directly be included in the graph of operations that are executed. But its input and outputs need to be defined:
analyze_cereals = define_dagstermill_solid(
    "analyze_cereals",
    file_relative_path(__file__, "notebooks/Analyze Cereals.ipynb"),
    input_defs=[InputDefinition("path", str, description="Local path to the Iris dataset")],
    output_notebook_name="analyze_cereals_output",
    output_defs=[
        OutputDefinition(
            dagster_type=FileHandle,
            description="The saved PDF plots.",
        )
    ],
)
When instanciating the graph as a job, the papermill resource needs to be supplied:
@job(
    resource_defs={
        "output_notebook_io_manager": dm.local_output_notebook_io_manager,
    },
)
def iris_analysis():
    analyze_cereals(download_file())
The graph directly includes the notebook as a simple step in the chain of operations:
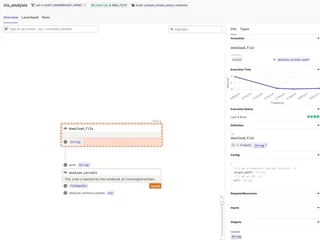
Again, the now known details such as execution time and input and output types can be viewed in dagit - if they are specified when defining the notebook operation. The direct display of such metadata in context increases observability and can really ease debugging of data pipelines.
preparing the notebook
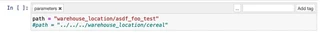
Papermill uses Jupyter cell tags to identify the cell to inject parameters at runtime. Tags can be displayed by clicking on (select View > Cell Toolbar > Tags from the Jupyter menu).
A cell needs to be tagged with: parameters.
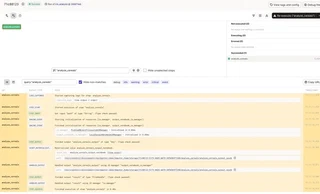
In case a notebook emits results - they can be tied directly to the run_id of the current run by accessing the active dagster context:
plot_path = "cereal_analysis_{run_id}.pdf".format(run_id=context.run_id)
dagstermill.yield_result(LocalFileHandle(plot_path))
The via yield_result these are made available as assets.
Again as already known, these can be directly viewed in the structured logs of dagit:
summary
Notebooks frequently live in a chaotic (scientific) world due to their flexible nature. Often, critical data science use cases start in a chain of notebooks. Some experimentation, others perhaps meant for more production-grade use. This can make it hard to operationalize the results.
Dagster can include notebooks directly into the E2E orchestrated data pipeline. Thus, it tames the chaos and can efficiently develop use cases as operationalization is not an afterthought. The supply chain of new data to the notebook is working batteries included.
