Turning the data pipeline inside out
Welcome 😄 to this blog series about the modern data stack ecosystem.
post series overview
This is part 2. It shows the power of inverting the concept of a traditional data pipeline: By turning it inside out, we get to talk about the assets we actually care about.
The other posts in this series:
- overview about this whole series including code and dependency setup
- basic introduction (from hello-world to simple pipelines)
- assets: turning the data pipeline inside out using software-defined-assets to focus on the things we care about: the curated assets of data and not intermediate transformations
- a more fully-fledged example integrating multiple components including resources, an API as well as DBT
- integrating jupyter notebooks into the data pipeline using dagstermill
- working on scalable data pipelines with pyspark
- ingesting data from foreign sources using Airbyte connectors
- SFTP sensor reacting to new files
what are assets?
Conceptually, software-defined assets invert the typical relationship between assets and computation. Instead of defining a graph of ops and recording which assets those ops end up materializing, you define a set of assets, each of which knows how to compute its contents from upstream assets. 😄 derived from https://docs.dagster.io/guides/dagster/software-defined-assets.
This means you start to turn the data pipeline inside out and reason about the things people actually care about: The materialized state and how to manage it, its evolution over time and quality and lineage.
Further reading material:
- https://dagster.io/blog/rebundling-the-data-platform
- https://docs.dagster.io/guides/dagster/software-defined-assets (as of 0.14.1 the API is stable)
a first asset
We start with a small dummy example job named minimal_assets:
sfo_q2_weather_sample = SourceAsset(
    key=AssetKey("sfo_q2_weather_sample"),
    description="Weather samples, taken every five minutes at SFO",
    io_manager_key='local_csv_io'
)

@asset
def daily_temperature_highs(sfo_q2_weather_sample: DataFrame) -> DataFrame:
    """Computes the temperature high for each day"""
    sfo_q2_weather_sample["valid_date"] = pd.to_datetime(sfo_q2_weather_sample["valid"])
    #return sfo_q2_weather_sample.groupby("valid_date").max().rename(columns={"tmpf": "max_tmpf"})

    yield Output(sfo_q2_weather_sample.groupby("valid_date").max().rename(columns={"tmpf": "max_tmpf"}), metadata={
        "path": EventMetadata.path('/path/to/file'),
        "value_counts": 10
    })
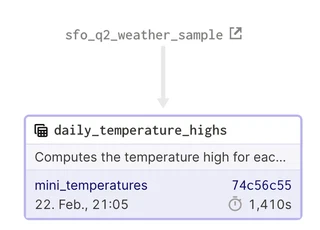
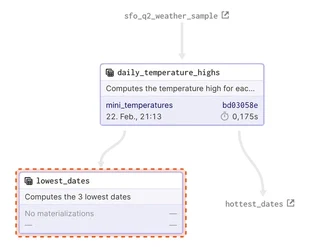
The SourceAsset defines an asset outside of the control of the data orchestrator (dagster).
It is used as the input for the graph of operations.
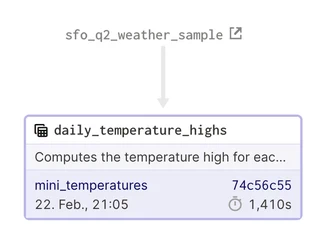
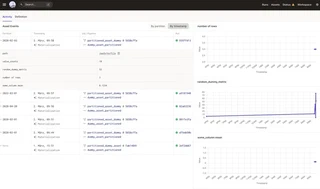
Already crucial information like the last materialization, the time required and reference to the job ID (for taking an in-depth look at the logs of that run) are available.
The asset tab shows additional metrics like the runtime of the asset materialization.
It can easily be customized to track more metrics, i.e., for data governance & data quality purposes.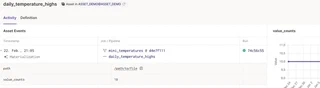
Multiple (software-defined) assets can be combined into a whole pipeline. Let us assume, we want to calculate the coldest and hottest dates from the dataset:
@asset
def hottest_dates(daily_temperature_highs: DataFrame) -> DataFrame:
    """Computes the 10 hottest dates"""
    return daily_temperature_highs.nlargest(10, "max_tmpf")

@asset
def lowest_dates(daily_temperature_highs: DataFrame) -> DataFrame:
    """Computes the 3 lowest dates"""
    return daily_temperature_highs.nsmallest(3, "max_tmpf")
This will create two new assets in the graph.
They can be combined into a job using the AssetGroup:
mini_temperatures_ag = AssetGroup(
    assets=[daily_temperature_highs, hottest_dates],
    source_assets=[sfo_q2_weather_sample],
    resource_defs={
        "io_manager": IOManagerDefinition.hardcoded_io_manager(LocalFileSystemParquetIOManager()),
        "local_csv_io": IOManagerDefinition.hardcoded_io_manager(LocalFileSystemCSVIOManager()),
    },
)

# here potentially a subselection of assets (which should be visualized in a single graph can be chosen)
# other assets not in a subselection can still be viewed though (but require more clicks)
mini_temperatures_pipeline = mini_temperatures_ag.build_job("mini_temperatures")
Notice the concept of the IO manager: Dagster separates the business logic from the underlying resources required for computation. This enables easy testability of data pipelines (with mock resources). As assets are materialized, a suitable IO manager needs to be chosen.
Further details: https://docs.dagster.io/concepts/io-management/io-managers
The code for the IO manager is found here: https://github.com/geoHeil/dagster-asset-demo/blob/master/ASSET_DEMO/io/simple_io.py#L10
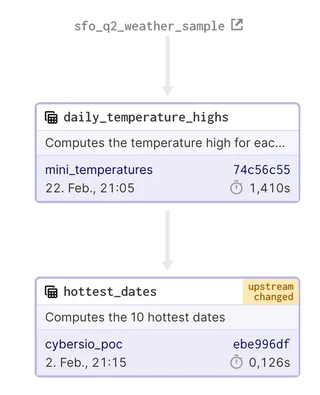
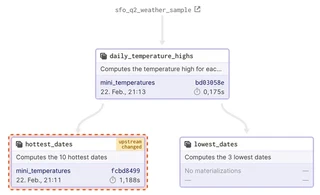
Now with a bigger graph the propagation of information is observable: When an upstream asset changes, all its downstream related assets become stale. This is marked in the user interface:
tame the chaos: lineage
When multiple data assets exist, it is essential to track the flow of information between them. The lineage graph shows where the data originated from and how it was transformed. As shown before, it can be used to figure out whether an asset needs to be updated due to upstream changes in the pipeline.
Multiple assets can be combined to derive a new one. Complex assets may exist or execute in a separate graph - perhaps managed by a different team handling that particular domain of data.
But it is still easily possible to see the big picture of the data dependencies.
The implicitly shown lineage of job_part_1 and job_part_2:
… can be expanded to a full overview with a click:
datasets rarely are static: partitions & backfilling
Usually, in a production setting datasets are rarely static. On a specific schedule updates need to be computed. Any such materialization of a triggered run from a schedule could perhaps fail. Usually, the data changes over time - and keeping the history of the changed data is a requirement.
Backfills can be used to re-run failed jobs or compute jobs on dates where the job did not run yet. Partitions allow to store each run (let`s assume date) uniquely and keep its history.
Talking about a batch workflow
But for sure, this is also true in the context of streaming. However, a dedicated streaming tool like Apache Flink might be a better choice where sub-second latency is required.
https://docs.dagster.io/concepts/partitions-schedules-sensors/schedules gives further insight into the available options around schedules, partitions and backfills.
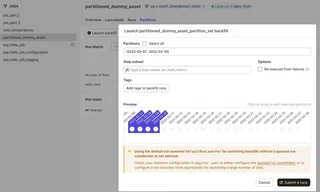
Let`s define a partitioned asset. We assume a daily batch update of the asset - which should start on a specific date.
For data governance, we want to track additional metrics. Perhaps the current materialization location, record counts or data quality metrics. Any metric can be added as a key-value pair to the asset.
@asset(partitions_def=DailyPartitionsDefinition(start_date="2022-02-01"))
def dummy_asset_partitioned(context) -> DataFrame:
    """Creates a mini dummy asset which is partitioned"""
    partition_key = context.output_asset_partition_key()
    # TODO 1: how to get the true partition key value and not its object?
    get_dagster_logger().info(f"Partitioned asset from: {partition_key}")
    df = pd.DataFrame({'foo':[1,3,3], 'bar':['a', 'b', 'c']})
    df['partition_key'] = partition_key

    rand_metric_dummy_value = random.randrange(0, 101, 2)
    yield Output(df, metadata={
        "path": EventMetadata.path('/path/to/file'),
        "value_counts": 10,
        "random_dummy_metric": rand_metric_dummy_value
    })
A run from the launchpad can be triggered for a specific configuration (i.e. date). But when backloading missing data it is easier to use the specific backfilling view in dagster. The desired range of partitions can be selected manually in the UI or by specifying the desired matching wildcard.
Do not forget to start the dagster-daemon:
conda activate dagster-asset-demo
dagster-daemon run
A dashboard visualizes the observability metrics emitted by the asset materialization over time for a given asset. For each materialization (of a partition) the metrics are historized and any change can be viewed directly. Here is an example of the execution time.
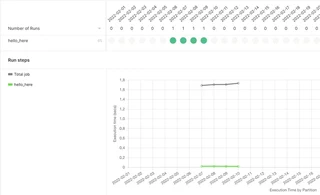
All the previously emitted metrics are historized and visualized.
The IO manager materializing the asset needs to be aware of the partitions! Otherwise, perhaps multiple runs of different dates might overwrite each other. Ensure that the partition key (date in this case) is part of the prefix/storage location to the asset:
file_path = os.path.join(self.base_path, context.step_key, context.asset_partition_key, context.name)
Furthermore, the IO manager can dynamically emit structured metadata about the materialized data. For example, an excellent overview of the schema of the stored data:
def pandas_columns_to_markdown(self, dataframe: PandasDataFrame) -> str:
        return textwrap.dedent(
             """
         | Name | Type |
         | ---- | ---- |
        """) + "\n".join([f"| {name} | {dtype} |" for name, dtype in dataframe.dtypes.iteritems()])

yield MetadataEntry.md(docstring_schema, "DataFrame columns")
notice how the asset can track metadata for a materialization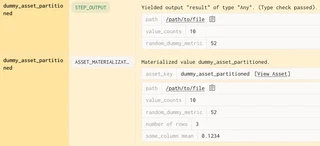
The markdown types can automatically be generated from the schema materialization and directly be viewed from the structured logs: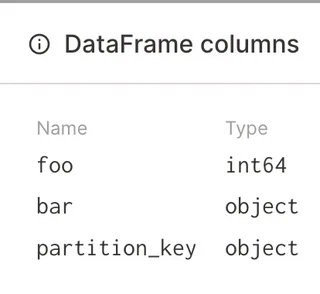
grouping assets
Asset Groups can be utlized to combine various assets into a single big overview. In particular, they allow to combine assets from different jobs, teams, which might be materialized on different schedules.
I have the feeling that with older generation 1 schedulers like Oozie in particular this global overview was hard to get.
Here in Dagster with the AssetGroup no complex logic is required.
summary
By flipping the data pipeline around, the essential aspects like materialized stateful data assets and quality indicators are put at the ❤️ of the pipeline. This is where they should belong - as users do not care about the transformations but the results.
Governance & quality indicators can be emitted for runs and are directly visible in a dashboard.
