Monitoring supply networks from mobile phone data for estimating the systemic risk of an economy
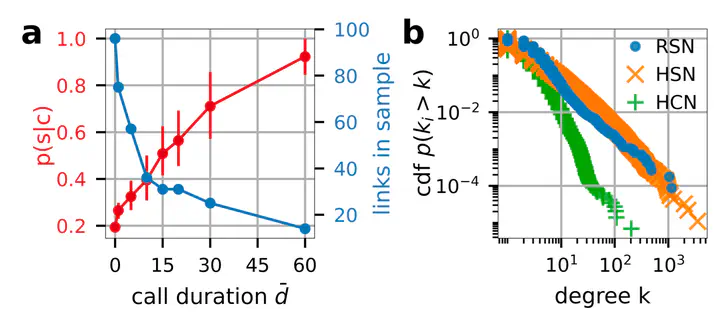 (a) Probability p(s|c) to find a supply link, given that there exists communication. (b) Cumulative distribution function for the degree. The degree distribution of the HSN is much more similar to the RSN than the HCN.
Abstract
Remarkably little is known about the structure, formation, and dynamics of supply- and production networks that form one foundation of society. Neither the resilience of these networks is known, nor do we have ways to systematically monitor their ongoing change. Systemic risk contributions of individual companies were hitherto not quantifiable since data on supply networks on the firm-level do not exist with the exception of a very few countries. Here we use telecommunication meta data to reconstruct nationwide firm-level supply networks in almost real-time. We find the probability of observing a supply-link, given the existence of a strong communication-link between two companies, to be about 90%. The so reconstructed supply networks allow us to reliably quantify the systemic risk of individual companies and thus obtain an estimate for a country’s economic resilience. We identify about 65 companies, from a broad range of company sizes and from 22 different industry sectors, that could potentially cause massive damages. The method can be used for objectively monitoring change in production processes which might become essential during the green transition.
Figure description:
(a) Probability $p(s|c)$ to find a supply link, sij , given that there exists a communication link, cij, between firms i and j for communication links exceeding a given call duration, dij. Error bars denote the quartiles of a bootstrap simulation described in SI Text 1.
(b) Cumulative distribution function $p(ki > k)$ for the degree k of the reconstructed supply network RSN (blue dots), hungarian supply network HSN (orange x’s) and human communication network HCN (green pluses). The degree distribution of the HSN is much more similar to the RSN than the HCN. Errorbars denote the quartiles of a bootstrap simulation described in SI Text 1.
This publication is currently a preprint.
Georg Heiler
Researcher & data scientist
My research interests include large geo-spatial time and network data analytics.